3D Printing: Reducing 2048 Experiments to Only 12
A real world example of experimental design


Coming up: a process engineer models part strength and quality of finish from the input settings of their 3D printers, and creates three optimum formulations.
Also, learn to quickly test up to 11 experimental variables to best optimize a precision manufacturing processes.
Optimising 3D Printed Parts for Strength and Finish
A graduate of our Advanced Lean Six Sigma Black Belt course, an engineer at a leading 3D printing company was looking to optimise the structural strength and cosmetic appearance of finished parts printed by their Fused Deposition Modelling (FDM) printers.
"…we can predict process outputs and optimise input settings to achieve target customer requirements…"
From just 12 experiments, this engineer was able to create a predictive model of his 3D printing process to optimise these properties, creating several optimum input formulations with minimal resource and material consumption.
Fused Deposition Modelling
Where a thermoplastic filament is extruded through a heated nozzle to build up, or "print" a solid part layer by layer. The extruded material must first bond to the build platform, then to subsequent layers of deposited material.

A Brief Intro to Experimental Design
Before discussing the method and results in this case study, we'll look at experimental design in some more detail.
Through a carefully chosen, small number of experiments, it's possible to model the output of a manufacturing process (e.g., structural strength, cosmetic appearance) as an effect of its inputs (printer settings, material used, etc.).
How to Choose Experimental Inputs
While there are many settings on an FDM 3D printer that may influence the final strength and finish of a printed part, and which can be used as experimental inputs, for a simple and practical study, we recommend keeping the initial candidate inputs to a maximum of 11. We'll see exactly why later.

Choosing Input Ranges
Experimenters should use their knowledge and experience to select the maximum and minimum, or the High and Low values for each of the inputs to their experiments. It is important to select as narrow a range as possible to improve the quality of prediction.
The High and Low values must at least span the likely range of influence, with a narrower range increasing the likelihood of a simple model producing a satisfactory result.
A wider range of possible values is likely to require a more complex model and an increase in experimental resources and time.
Screening the Input Variables
Initially, we recommend performing a small number of screening experiments using an experimental design aimed at identifying the most important input variables, those that have the greatest effect on the output.
Quite often, these initial screening experiments will be sufficient to produce an accurate predictive model to meet our objective. If not, then the knowledge gained enables us to design modelling experiments using just those inputs.
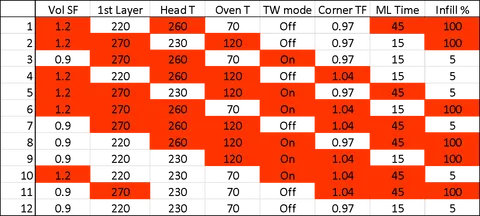
Plackett and Burman1, recommend that 12 carefully chosen experiments are enough to screen up to 11 inputs. This is a dramatic reduction from the total 211 or 2048 High and Low combinations of 11 input variables.
If it is also reasonable to measure several process outputs while we conduct each experiment, we can then separately model each of the outputs we're studying with only one round of experiments.
In Depth: Fractional vs Full Factoral
The Plackett & Burman is a highly fractional design. To understand what this means, we need to understand what a full factorial design is. Performing a full factorial study with 8 inputs and 2 possible settings for each input would call for 28, or 256 experiments. This is likely impractical, in which case a fraction of that set would need to be chosen.

Controlling Other Inputs, Environmental Factors and Measurement Error
Whether they are other inputs or environmental, minimising variation in external factors that affect the output is key. Good conduct of experiments to ensure repeatability of measurement of both inputs and outputs is vital. Measurement errors or poor repeatability of input settings could render the models inaccurate.

Measurement error of the inputs and outputs will introduce noise into the data and make the models less reliable. Careful preparation and good experimental technique are essential in this respect.
If there is any uncertainty about the repeatability of any of the experimental measurements, we should first conduct a measurement systems analysis (MSA) of those measurement processes.
Preparation of Test Pieces
A 3D test model was created that provided several surfaces to assess both the cosmetic quality of appearance and the surface roughness measurement. Each was positioned in the three major axes to give a set of orthogonal measurements. Surface roughness and cosmetic visual assessment were treated as independent variables.
The criteria for acceptable surface finish were not simply numerical but include a cosmetic assessment related to visual appearance. First, it was judged by human appraisal against reference standards on a 1-10 scale, and also measured using a standard contact profilometer to show a numerical Ra value.
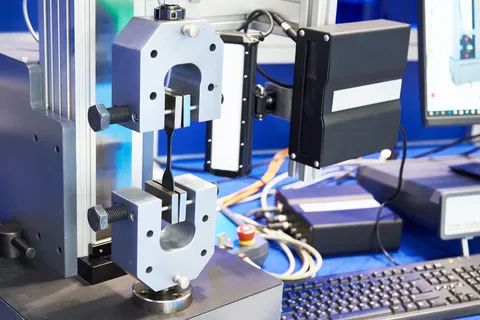
Measuring the structural performance of the printed test model required several test measurements from each of the three major axes. These were tested to failure, measuring ultimate tensile strength in MPa and elongation at break in %.
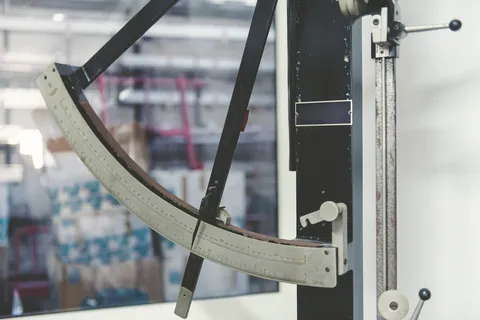
An additional test for impact strength was also carried out. A typical tensile test specimen is shown above with a central gauge section as a standardised cross-section for testing.
Each experimental run generated nine values relating to the strength properties of the material. Separate models for each of these values were made, but for simplicity, the data for each of the three axes were also combined with no significant loss of predictive quality.
Data Collection
Each experiment generated 15 data points. For each of the two main properties of interest, strength and cosmetic finish, two or three measurements in each of the three axes were taken.
This amount of data should be considered unusual as, more commonly, only one or two output data points are collected. This demonstrates the flexibility of the design of experiments in optimising multiple outputs with one set of experiments.
| Response | Unit | Typical Values |
|---|---|---|
| UTS | Mpa | 30 |
| Elongation | % | 8% |
| Izod unnotched | J/m | 290 |
| Surface Roughness | Ra Microns | 20 – 3 |
| Cosmetic Finish | Appraisal | 1 – 10 |
The standard recommendation by Plackett and Burman is to perform 4 replications of each experiment, totalling 48. They further recommend that each round of 12 experiments should be randomised to spread the effects of environmental factors. This can add considerable time and resources needed, and experimenters will often batch repeats, completing each experiment 4 times, one after another, to reduce set-up times.
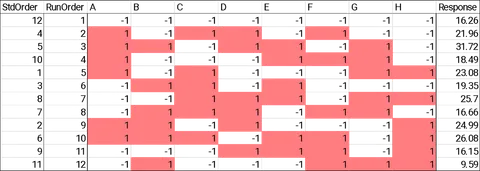
In this study, only one round of 12 experiments was completed, and the results were analysed to determine if there was sufficient prediction quality from the reduced data set. With this reduced number, only 12 separate 3D models were printed.
Analysis and Interpretation
The data was analysed using the statistical method of analysis of variance (ANOVA, we recommend JASP as a free alternative for this analysis).
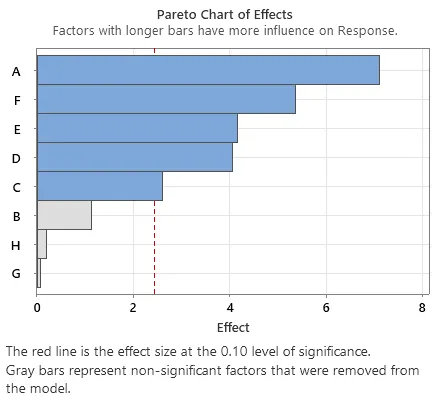
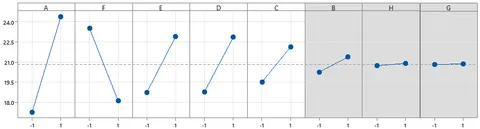
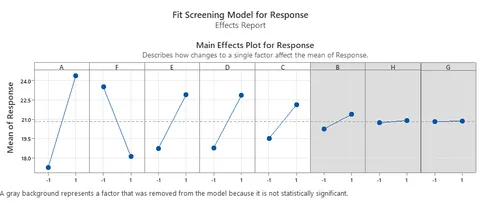
Inputs below a 90 percent level of significance in the analysis of the screening experiment data were removed from the next round of testing.
Of the five significant terms in the particular model discussed here, F has a negative effect and must be set to Low to maximise the response, while the others are positive and must be set to High.
Results & Conlusions
Three input formulations were created from the results of the full analysis, with the following effects on output:
- Maximum yield strength at the expense of some cosmetic finish
- Maximum cosmetic finish at the expense of some yield strength
- Acceptable yield strength and cosmetic finish without maximising either
Using the design of experiments need not be a daunting prospect. If simple principles and advice are followed on the selection and conduct of experiments, a useful result can be obtained in with minimal time and resources.
Learn More
To learn about the design of experiments in more detail, and other techniques for advanced manufacturing, enquire about our Advanced Lean Six Sigma Black Belt course.
References
1. Schmidt & Launsby Understanding Industrial Designed Experiments, Air Academy Press